A few examples of how the map knowledge elements might look (done in Jekyll and not using I-GUIDE Platform styling.)
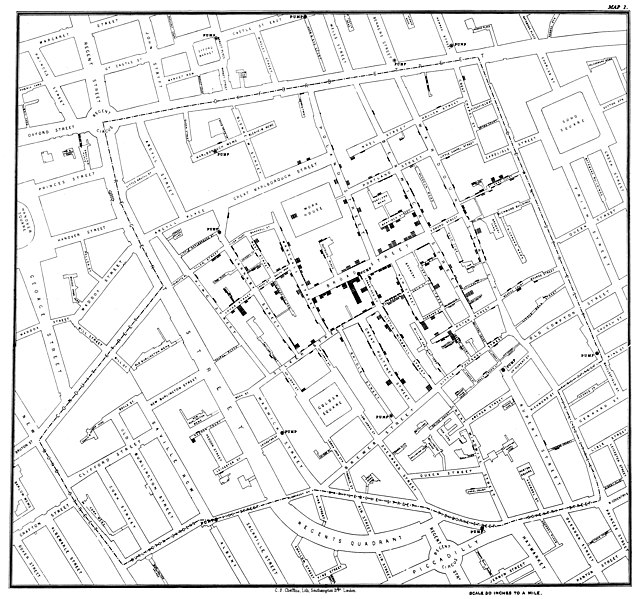
Asking the Right Questions in Spatial Analysis: The Case of John Snow
WhereCOVID-19: Mapping Multi-Scale Spread and Impacts of COVID-19 for Spatial Decision Support
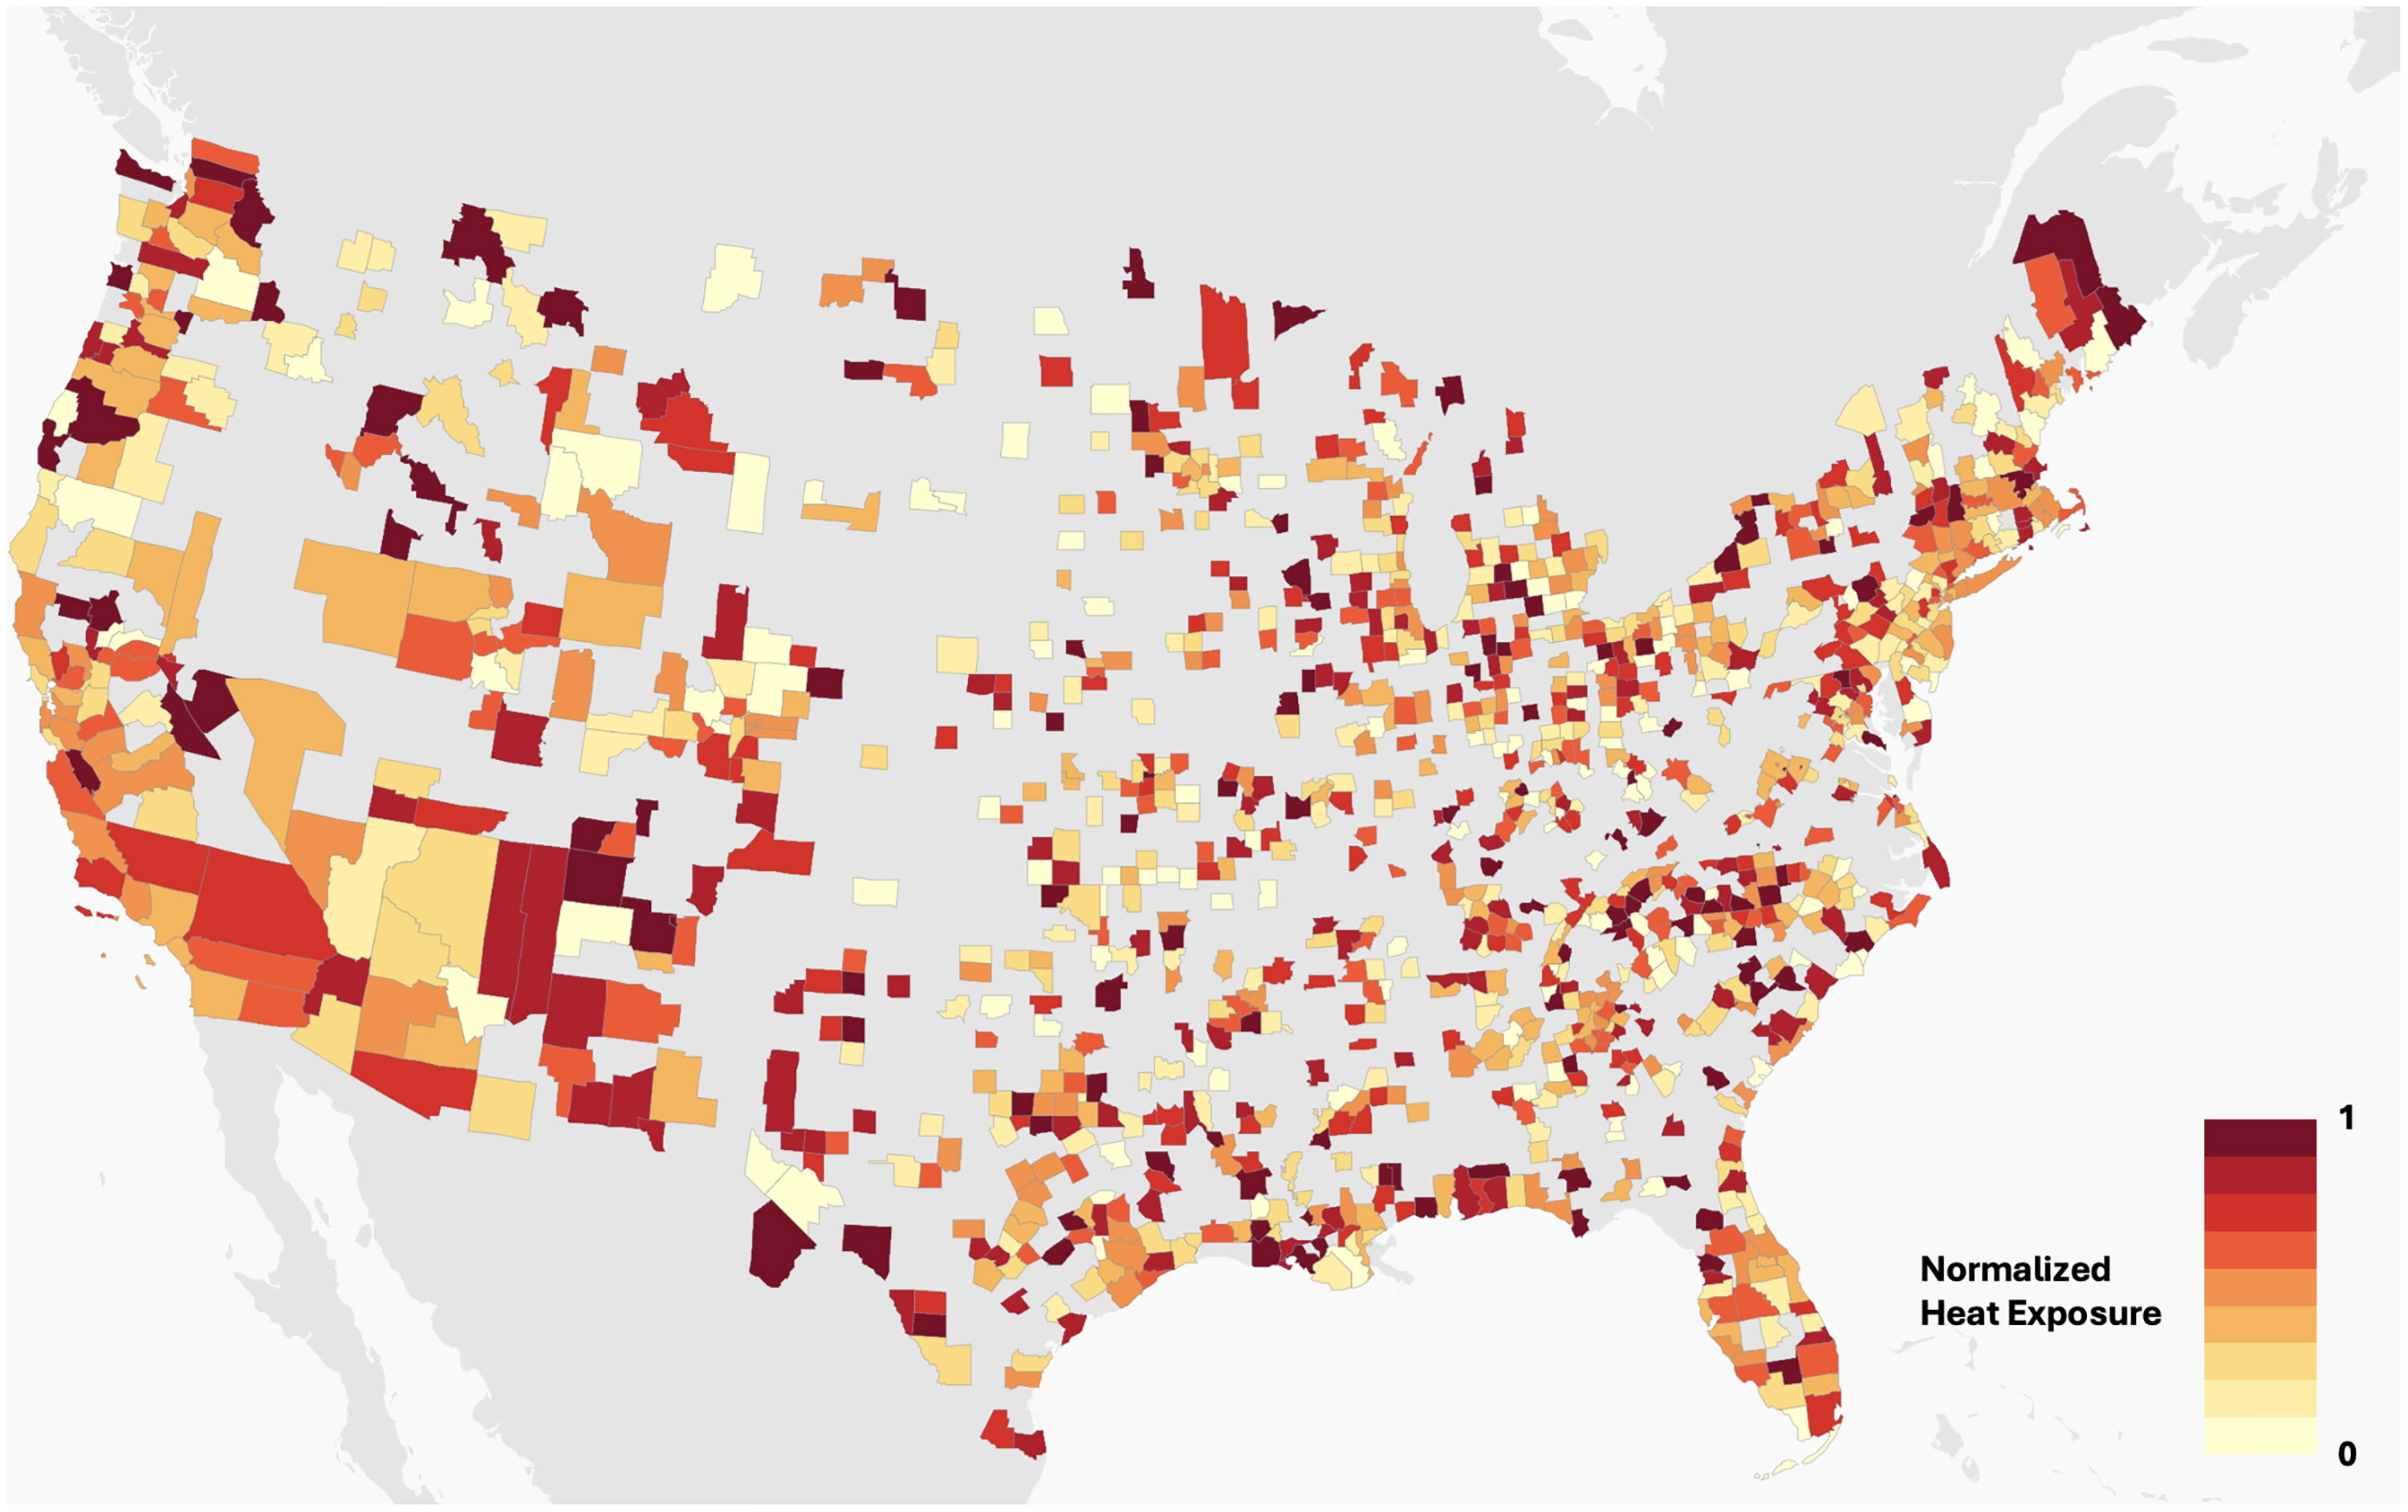
A national-level heat exposure map in the United States on 2021.9.27.
Oregon Department of Transportation
Description
Interactive dashboard to help plan the Oregon Electric Vehicle Charging Station network.
Below is a preview of the map, you can access the map at https://kai.maps.arcgis.com/apps/CrowdsourceReporter/index.html?appid=faf1c627e8884c21a8f1933d69e74274

John Snow
Description
John Snow's map of cholera

Marcos Falcone
Description
An interactive story map about spatial analysis using John Snow's cholera map as an example.
Below is a preview of the map, you can access the map at https://uploads.knightlab.com/storymapjs/a0d512bc2bc17977f1029fedead0329a/trying-out/draft.html

CyberGIS Center
Description
The ongoing COVID-19 pandemic has put the world into an unprecedented situation causing massive impacts on populations and businesses. While there exist numerous geospatial data portals and resources for fighting against the COVID crisis, a major challenge is that few of these are based on rigorous geospatial analysis and modeling as many simply report COVID-19 cases and summary statistics. To tackle this challenge requires detailed data on populations, health care services, and high-risk settings, along with decision support tools for geospatial analytics and place-based intervention. Dynamic and interactive mapping informed by rigorous geospatial analysis and modeling is urgently needed for understanding how COVID-19 spreads across a number of spatial and temporal scales in different population contexts and for supporting decision making to mitigate the spread and save lives. However, such geospatial analysis and modeling are often computation- and data-intensive, and thus requires integration with and enablement by cyberGIS – geospatial information science and systems (GIS) based on advanced cyberinfrastructure. Therefore, the CyberGIS Center for Advanced Digital and Spatial Studies at the University of Illinois at Urbana-Champaign has established the WhereCOVID-19 platform to pursue important knowledge of multi-scale spread and impacts of COVID-19 while producing a unique and critically urgent capability for spatial decision support. Specifically, WhereCOVID-19 maps and predicts where COVID-19 is spreading across a number of spatial and temporal scales while providing an online spatial decision support system for identifying populations at risk and targeting health care interventions. The platform is developed collaboratively with public health and epidemiology researchers as well as public health officials with the aim to provide a one-stop geospatial data and analysis system to support cutting-edge research and timely decision-making. WhereCOVID-19 seeks to answer a number of critical “where” questions such as where COVID-19 cases are and will likely be; where vulnerable populations are; where containment and mitigation measures should be applied; where health care services might be overwhelmed; and where additional health care resources should be deployed. WhereCOVID-19 is committed to providing mapping and spatial decision support capabilities based on scientific understanding of how spatiotemporal patterns and trends of COVID-19 relate to population characteristics and health care resources. The WhereCOVID-19 platform is made available to the general public, a broad range of stakeholders, and research and education communities. Currently, WhereCOVID-19 provides a collection of static and dynamic maps for estimating the spread and exposure risk of COVID-19 at various spatial and temporal scales. For example, a set of vulnerability maps synthesize information of confirmed COVID-19 cases, tested cases, population density, social vulnerability index based on CDC data, people living with HIV, and SpatialAccessibility to hospital resources based on a linear model. Another example is a suite of maps representing SpatialAccessibility to healthcare resources based on the outcome of a recent study: https://medrxiv.org/cgi/content/short/2020.05.06.20093534v1. ""
Below is a preview of the map, you can access the map at https://wherecovid19.cigi.illinois.edu/spatialAccess.html

Fangzheng Lyu
Description
A national-level heat exposure map in the United States on 2021.9.27 using location-based social media data. Map from: https://doi.org/10.1080/13658816.2024.2343063

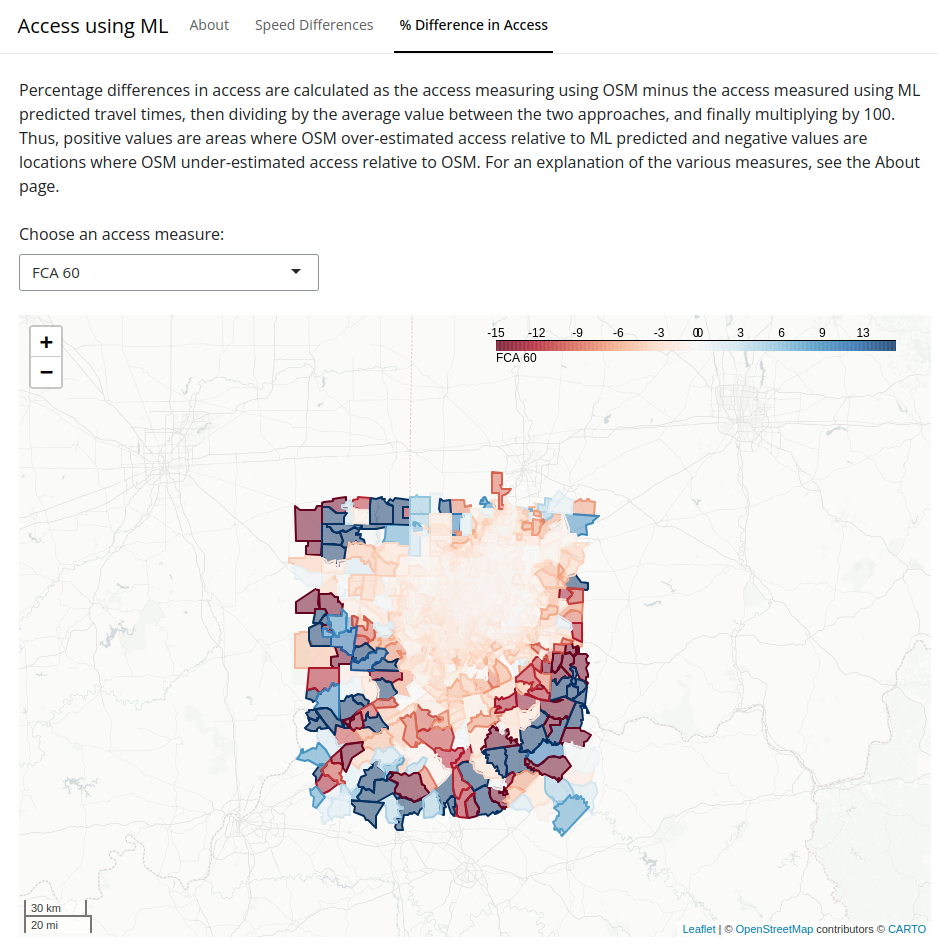
Alexander Michels
Description
This work examines how speed limits vary from the actual travel speeds on urban roads, affecting spatial accessiblity measures. We use machine learning trained on granular travel-time data to dervive our predicted travel speeds and then compare a variety of spatial accessibility measures using speed limits and our predicted travel speeds.
Below is a preview of the map, you can access the map at https://alexandermichels.github.io/SDOH2024ShinyApp/

Library of Congress
Description
A story map by the Library of Congress examining some of the world's most influential maps.
Below is a preview of the map, you can access the map at https://www.loc.gov/ghe/cascade/index.html?appid=ddf9824ff56b4fb6a0f3e11515716738&bookmark=150%20AD
